BTCMXN Trades Close to Support Level 205,466
July 14, 2020
The Shanghai Composite Index Begins to Fall
July 15, 2020
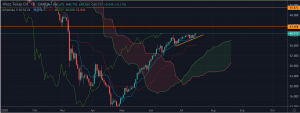
The trend of crude oil can be described as ups and downs. Since the production cut by OPEC in May, the crude oil price has been going up and up. For now, the price is only three dollars away from the lowest point in March.
From the Bollinger band, the oil price has been sitting above the middle band and climbing along with the upper band. Ichimoku Cloud is a very useful tool for insight into market trends. Ichimoku Cloud on WTIUSD shows a good performance, and the price of crude oil has appeared from the cloud since June and shows a steady upward trend. The conversion line is above the baseline which also shows a strong momentum of the buying power. The cloud has become thick, meaning the support level has been stronger. RSI indicator is at the level of 67%, and it declares the slowing of the growth rate, but the whole trend is still upward.
What do you think? Will the crude oil continue to grow to the next resistance level of 43, then up to 50?
This post does not provide Financial Advice for traders, its merely purpose is education, use all the information available from different Analysts and build your own strategy, trading is not for everyone, you should only trade with money you can afford to lose, past performance is not an indicator of future results.

