ETH Breaks Resistance Level At 242.85
July 21, 2020
DXY Analysis
July 21, 2020
USDJPY CHART PRICE – USDJPY DAILY
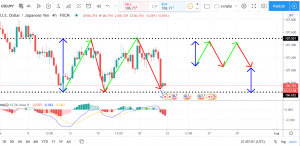
I think most traders are familiar with this pattern, a double-top pattern. Although the pattern is not very precise, it still has the attributes. Two tops are in the same hight, three low points are at the same level.
Now, back to our question, what does this mean?
A double top pattern is a signal of a downward trend. The downward trend would continue to go down until it goes the same level as the bottom to top, as I mark in the chart with a double arrows line.
Although the M pattern seems to make sense to the situation, we observe green candle latest. Is this an upward trend beginning?
Don’t worry, let’s find something else.
The MACD shows a downward trend in price and I do not think there is a signal of a cross yet. This could give me some confidence.
In conclusion, let’s expect the downward trend to continue.
This post does not provide Financial Advice for traders, its merely purpose is education, use all the information available from different Analysts and build your own strategy, trading is not for everyone, you should only trade with money you can afford to lose, past performance is not an indicator of future results.


