Is This a Clear Path for BTCMXN?
July 16, 2020
GBPUSD – Magic Fibonacci Retracement
July 17, 2020
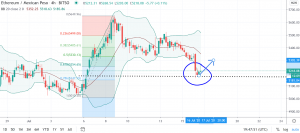
ETHMXN CHART PRICE – ETHMXN 4H
The title is straightforward enough right?
The most obvious signal is the breakout of Bollinger Bands. The price could bounce back to the middle when it touches the border, and if we consider the recent move as a retracement of the previous trend, then the point that I mark with a blue circle could be a support point, which is just at around 0.786 level of Fib retracement.
Also, we have other proofs to support our prediction. The RSI line goes through an oversold point and is going up now. So I would say that this is the reversal signal.
But if we look at the MACD, it does not give us enough confidence. Don’t worry, let’s take a closer look at this MACD again. Two lines seem to get together now, I would say they are on the way to cross.
Above all, let’s expect the reverse in the near future.
This post does not provide Financial Advice for traders, its merely purpose is education, use all the information available from different Analysts and build your own strategy, trading is not for everyone, you should only trade with money you can afford to lose, past performance is not an indicator of future results.


