DXY Technical Analysis
July 16, 2020
Let’s Wait for a Bounce on ETHMXN!
July 16, 2020
BTCMXN CHART PRICE – BTCMXN DAILY
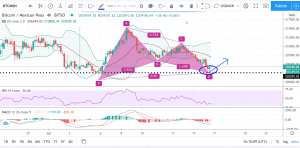
I would say no actually. The chart does not review too many signals, however, using two peaks to build a Gartley pattern still makes sense here. Now let’s see this pattern, first I have to say that some moves do not accurately fit the Fib levels. I still consider it a Gartley pattern. As can be seen, the point D is just the last point, which is also a breakout. You can see that some candles break out from the lower band of Bollinger bands.
So are you persuaded by the pattern?
If not, you can take a look at the RSI and MACD lines. Those two lines are going down now. Don’t worry. The blue line of MACD is already going up now and could form a cross in the near future which is a signal of an upward trend.
In conclusion, let’s expect the price to go up in the near future, and we are just at the support point.
This post does not provide Financial Advice for traders, its merely purpose is education, use all the information available from different Analysts and build your own strategy, trading is not for everyone, you should only trade with money you can afford to lose, past performance is not an indicator of future results.


