Next Target for USDJPY
July 10, 2020
ETHUSD Tests Resistance
July 13, 2020
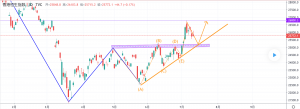
HSI CHART PRICE – HSI DAILY
The overall trend of the HSI is still going up following the support line. Based on the performance of Bollinger Band, the price of the Hang Seng Index has broken up the upper band of the Bollinger Band, which is the resistance level. After breaking up, the price has been beginning to drop. As can be seen from the Relative Strength Index, the HSI has reached a high overbought level of 59%, which does not send an obvious overbought or oversold signal to the market. However, the overall trend is upward, which means buying power momentum is still strong. According to the MACD indicator, the column line is above the zero axis, but it is no longer elongated; instead, it is shortened, which confirmed the dominant status of the buying power, but the strength of buying has gradually weakened. Therefore, the trend in the short-term price will go down.
From the trendline and above indicators, the price of HSI will retest the new support line 25300 then rise again to test the resistance level at 26800.
Important support level: 25270
Important resistance level: 26800
This post does not provide Financial Advice for traders, its merely purpose is education, use all the information available from different Analysts and build your own strategy, trading is not for everyone, you should only trade with money you can afford to lose, past performance is not an indicator of future results.


