Let’s Wait for a Bounce on ETHMXN!
July 16, 2020
USDMXN Closes the Week With Gains
July 17, 2020
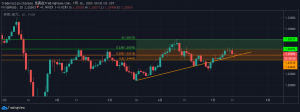
GBPUSD CHART PRICE – GBPUSD DAILY
Fibonacci retracement is a good indicator to find important support and resistance levels.
From the 4 hours chart, the Bollinger Band tends to squeeze, and the price has been crawling from the lower band to the upper band. According to the daily chart, the Pound Dollar has fluctuated between the upper and lower bands of the Bollinger Band. MACD indicates the dominant status of the buying power and the RSI indicator does not show a clear trend with an overbought level at 54%.
I believe the Pound Dollar will go up to test the next resistance level.
Important resistance level: 1.26393,1.28137
Important support level: 1.25570,1.24443
This post does not provide Financial Advice for traders, its merely purpose is education, use all the information available from different Analysts and build your own strategy, trading is not for everyone, you should only trade with money you can afford to lose, past performance is not an indicator of future results.


