EUR Could Lose Some Ground to MXN
July 16, 2020
DXY Technical Analysis
July 16, 2020
AUDUSD CHART PRICE – AUDUSD 4H
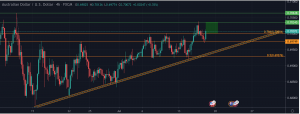
The whole trend is going up. Before the price dropped, it broke out the resistance level at 0.70004 and continued to go up, reaching the next resistance level at 0.70345. However, it did not test the support level at 0.69276; instead, when the price dropped to the middle band of the Bollinger band, it reversed to go up. According to the MACD, after a short death cross, a golden cross showed up, and the column lines turned to green strongly, which indicates the increased momentum of the buying power. The RSI indicator is at the overbought level of 58% currently, which also identifies the continuing ascending trend. The price will choose a direction after reaching the resistance level at 0.703, either continue to go up to the next resistance level of 0.706, or reverse to test the support level at 0.70.
Important resistance level above: 0.70345,0.70638
Important support level below: 0.69749,0.69276
This post does not provide Financial Advice for traders, its merely purpose is education, use all the information available from different Analysts and build your own strategy, trading is not for everyone, you should only trade with money you can afford to lose, past performance is not an indicator of future results.


