BTCUSD Started With a Loss
July 28, 2020
Rising Wedge and Fibonacci? USDCNH
July 28, 2020
EURJPY CHART PRICE – EURJPY 4H
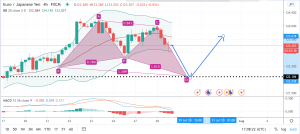
I would like to mark this harmonic pattern on my chart because this is beautiful and clear, yes the butterfly is beautiful and the signal is clear which is bullish. As we can see, when the price meets the point D, the price could potentially start to go up. So in my prediction, the price would go down to point D and after that, I expect the price to start going up
How could I know that the price would meet point D?
I checked the MACD and it shows that the price is going down and the cross seems a little bit far from now. So I guess the price may keep going down for a while. Then I make this Gartley plot, which has a point D in the future.
This post does not provide Financial Advice for traders, its merely purpose is education, use all the information available from different Analysts and build your own strategy, trading is not for everyone, you should only trade with money you can afford to lose, past performance is not an indicator of future results.


