Unstable Dash
July 20, 2020
EURUSD Is Ready to Change Direction, Prepare to Short
July 20, 2020EURGBP Technical Outlook


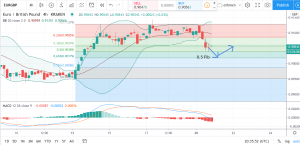
EURGBP CHART PRICE – EURGBP 4H
What do you think of the fluctuation after the upward trend I marked?
Is that confusing?
The situation now is a little bit tricky. I do not observe a clear trend for the long term. So I would like to see a short term trend.
Let’s just focus on the recent upward movement first.
The price goes up and fluctuates at this level for a while, so I mark the upward movement with the Fibonacci Retracement.
Then, The latest price already breakout from the Bollinger Bands. As can be seen, the Bollinger Bands form a trumpet-shaped form, which means the price would be more volatile. Although the price always backs out to the middle of the Bollinger Bands, I still consider the sale pressure is stronger. Then when would be the point for changing the direction of the trend? I expect the price retrace to the 0.618 level, which means the price would continue to go down for a while.
In conclusion, I would expect the price to go down to the 0.618 fib level, which is 0.90180. Then go back to meet the middle line of the Bollinger Bands, which might be at 0.90532.
This post does not provide Financial Advice for traders, its merely purpose is education, use all the information available from different Analysts and build your own strategy, trading is not for everyone, you should only trade with money you can afford to lose, past performance is not an indicator of future results.


