USDMXN Closes the Week With Gains
July 17, 2020
SHCOMP Finally End the Downtrend of a Week
July 17, 2020
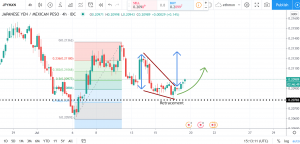
JPYMXN CHART PRICE – JPYMXN 4H
The JPYMXN seems to have no clear trend recently. An unstable situation could be a chance for traders!
First, I use recent high and low to build a Fib and see if any candle reaches the fib lines. Luckily, I found one, and I marked the retracement with the black dashed line. This dashed line is at around 0.786 level, which is a hard level.
Next, I found a falling wedge pattern. This is a bullish signal. I use blue arrow lines to mark out the rising range, which is according to the wedge pattern. Also, the support point of the wedge pattern is the resistance point for the previous Fib.
Now let’s see the MACD lines. The reverse already shows up, so we observe a clear cross with the blue line on top. This is also a signal of rising.
In conclusion, I would say that the price may go through a bullish in the near future.
This post does not provide Financial Advice for traders, its merely purpose is education, use all the information available from different Analysts and build your own strategy, trading is not for everyone, you should only trade with money you can afford to lose, past performance is not an indicator of future results.


