AUDUSD Trend Analysis
July 16, 2020
Is This a Clear Path for BTCMXN?
July 16, 2020DXY Technical Analysis


DXY CHART PRICE – DXY 4H
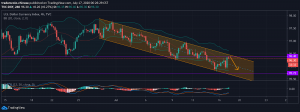
According to the Bollinger band and RSI indicator, DXY is still in the big trend of downward. The price has been wandering between the middle band and the lower band of the Bollinger band. Currently the RSI indicator is at 50%, with a weak uptrend momentum. From the performance of the MACD, two moving averages of DXY have created a golden cross below the zero axes, which could be seen as a small reversal of the downtrend of DXY indicator. As for whether the US dollar index can break through the resistance level of 96.4 and turn around, it still exists as a big question mark. I recommend going short on DXY.
Important Resistance Level Above: 96.40
Important Support Level Below: 95.72
This post does not provide Financial Advice for traders, its merely purpose is education, use all the information available from different Analysts and build your own strategy, trading is not for everyone, you should only trade with money you can afford to lose, past performance is not an indicator of future results.

